O Dan y Dŵr - Hidden Seascapes of Wales
Multibeam sonar systems, data collection, processing outputs and applications
Multibeam Echo Sounders (MBES) are sonar-based instruments commonly used to survey and map the seabed, due to recent technological advances these systems now provide us with the ability to visualise marine environments to an incredibly high level of detail and analyse marine processes in new and exciting ways.
The sonar system emits and collects a series of acoustic pulses at specific frequencies that form a swathe (a 2-dimensional cross-section) across the seabed. By measuring the time taken for each pulse of sound to travel to and from the sonar system after reflecting off the seabed and knowing the speed of sound in seawater, a distance from the sonar to the seabed can be calculated.
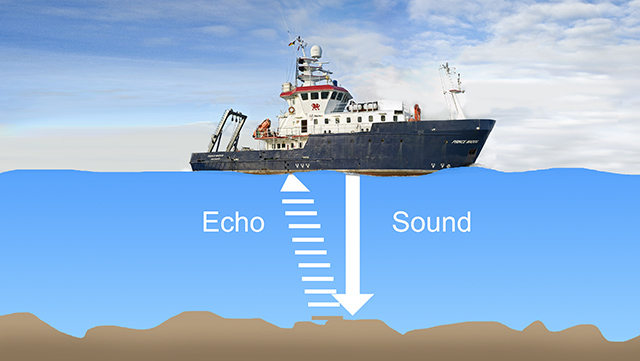
Single beam
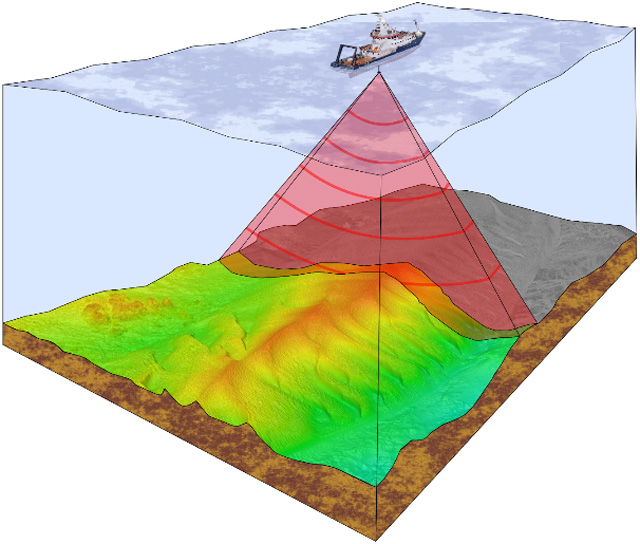
Multibeam
Multibeam systems are varied in size and type depending on what water depths are to be surveyed and can be hull mounted or deployed on poles and transferred between vessels. Bangor University via investment through the SEACAMS project have been using two multibeam systems since 2012 (Teledyne SeaBat 7125 and 7101) and have recently invested in a third, the Teledyne SeaBat T-50 P, which has been permanently mounted into the hull of our 35m long research vessel Prince Madog. The Prince Madog is used to survey sites offshore in deeper waters whereas shallower sites are surveyed using our smaller inshore vessel Macoma, being able to survey both inshore and offshore sites provides our marine scientists with the ability to obtain total and seamless sonar coverage of the whole marine environment.
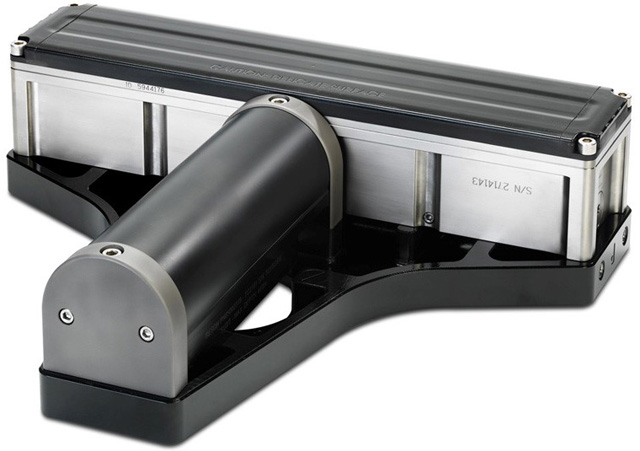
Teledyne SeaBat T-50 P transducer
Once the sonar data has been collected it needs to be corrected to compensate for numerous factors including movement of the survey vessel (pitch, roll and heave), changes in tidal height (surveys can be continuous, often over periods of many hours) and adjusted to a common datum (height). In addition to all the changes in the vertical plane all data points will need to be assigned a value with respect to a coordinate and this is achieved by having a highly accurate position fixing and reference system set up on whatever vessel is being used. The data also needs to be manually 'cleaned' in order to remove erroneous signals generated by objects in the water column such as fish or debris, additional reverberation type reflections arising from beams reflecting off harder surfaces such as rocks or the steel hulls of sunken ships etc. Data from adjacent and/or repeat surveys over the same site can be linked to provide scientists with the ability to better understand marine processes over large areas and/or over various timescales.
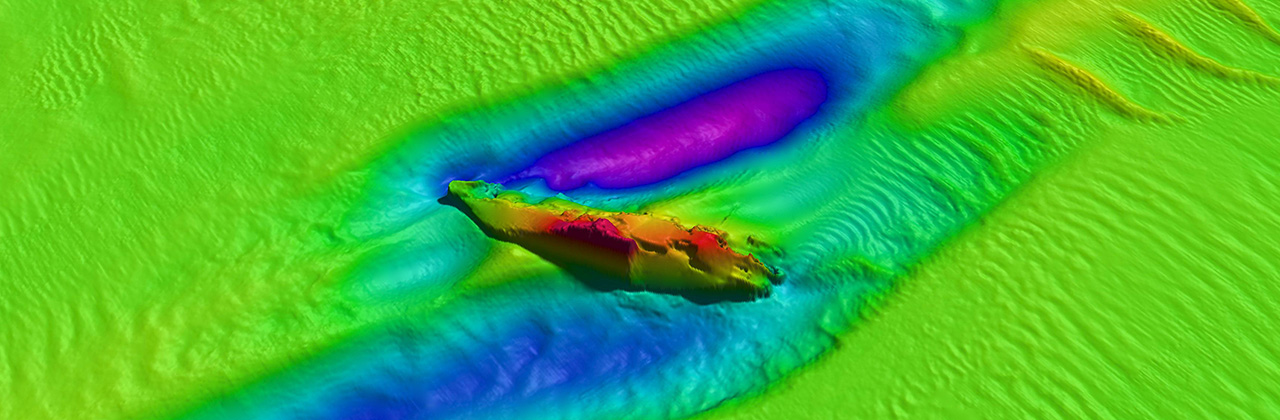
Once this has been done the clean data (points) with height and position values are 'gridded' at an appropriate resolution (average density of points that result in a meaningful model of the seabed). These outputs (based on joining individual points) are colour coded based on a height scale to make interpretation easier, usually with red representing the shallowest point in the data set and blue the deepest. These depth models provide information on the shape and form of the seabed and when observed in context of the wider area often also provides useful insights on what the seabed is made of, for example rocky outcrops are easily distinguishable from mobile bedforms such as sandbanks or more rigid and static areas of seabed composed of much harder compacted material.
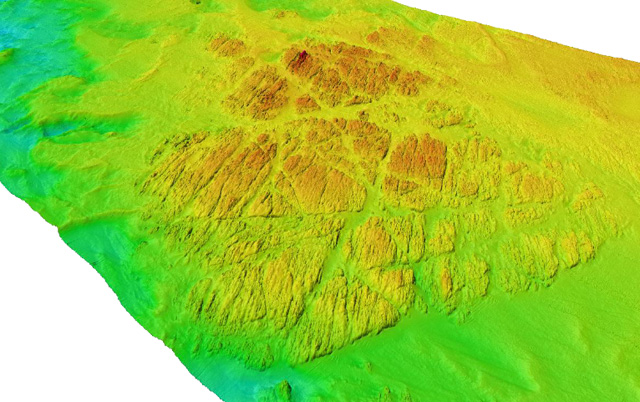
MBES data showing the structure of an area of seabed
Sonar data from the water column itself can also be analysed to provide information to biologists on how animals use different water depths at different stages of the tidal cycle or season, particularly around wrecks or rocky outcrops. The sonar signals themselves can also be used to infer physical properties of the material making up the seabed based on the strength of the pulse that is returned, for example a rock will generate a very different returning signal to one that has reflected off softer mud.
Multibeam sonar outputs can be amalgamated with other sources of information such as maps, charts or satellite images and can also be used in conjunction with mobile technology to provide end-users including, scientists, government agencies, private sector companies and the general public with the ability to visualise marine environments in new and exciting ways that will improve the way we utilise and manage our marine environment.
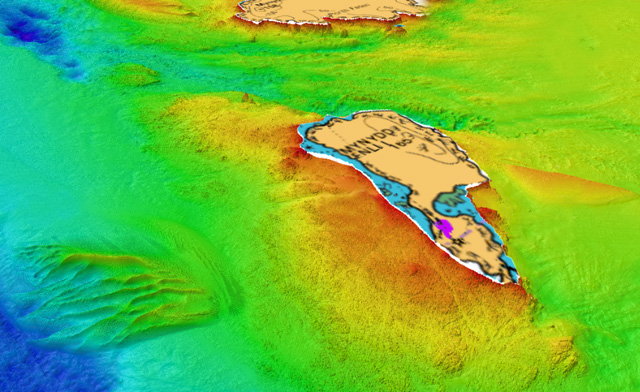
MBES data taken from Bardsey Island on the Llyn Peninsula
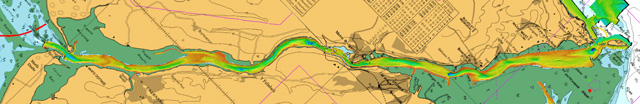
Combined MBES surveys of the entire length of the Menai Strait overlaid on an Admiralty chart
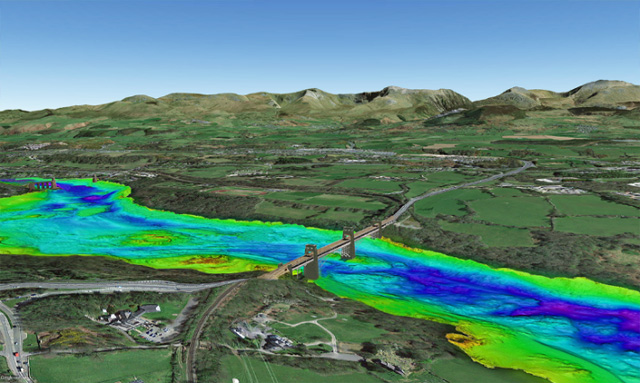
MBES data taken from the 'Swellies' region of the Menai Strait superimposed on a Google Earth image